


Research is only powerful when it meets the metrics leaders already care about.
You can run strong studies, uncover sharp insights, and still hear the same question in the next roadmap meeting.
How does this connect to our KPIs?
This issue is about making that link visible. When you map insights to active business metrics, you shift the conversation from “interesting findings” to “essential direction.”
In This Issue
• Why KPIs matter for UX influence
• The three KPI categories that absorb 90 percent of research insights
• A simple mapping framework
• Examples
• Common mistakes
• Resource Corner
Why KPIs matter for UX influence
Most leaders are not ignoring your research.
They are filtering for relevance.
They are asking:
• Does this insight protect revenue
• Does it reduce cost or risk
• Does it support this quarter’s goals
• Does it help us grow the metrics we track every week
When your insights plug into those metrics, they stop being “nice to know” and start shaping decisions.
Upcoming UXU Meet-Up: Mastering UX & Product Management Collaboration
Great products are built when UX and Product are aligned around the same decisions and tradeoffs.

This session brings UX professionals and Product Managers together to talk honestly about:
How product decisions are really made
How UX can influence direction without titles
Where collaboration breaks and how to fix it
How AI is changing UX and Product workflows
If you work at the intersection of UX, Product, and delivery, this session is for you.
👉 Free to attend. Limited seats.
Location
TBD
The three KPI categories that absorb most UX insights
Almost every organization has versions of these.
1. Acquisition and Activation KPIs
Examples: signup rate, first-run success, onboarding completion, trial conversion.
Most usability issues influence activation more than teams expect.
2. Engagement and Retention KPIs
Examples: weekly active users, feature adoption, return rate, churn indicators.
These KPIs respond strongly to clarity, motivation, and reduced friction.
3. Cost and Efficiency KPIs
Examples: support ticket volume, task time, error rate, rework hours.
These are often the fastest path to proving your value.
Once you know which bucket your insight belongs to, you know which leader will care and why.
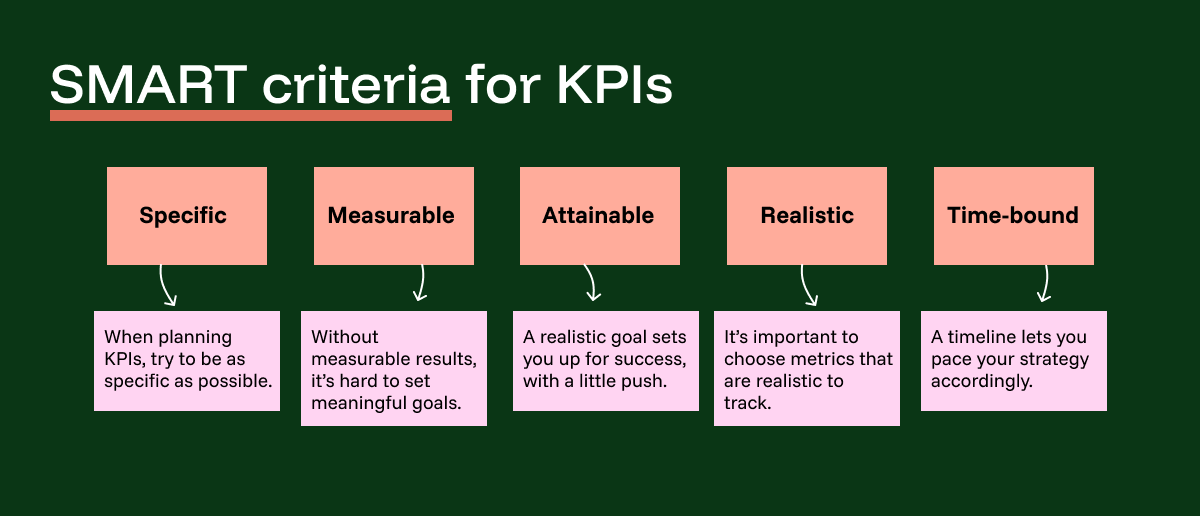
A simple framework for tying insights to KPIs
Use this 4-line script.
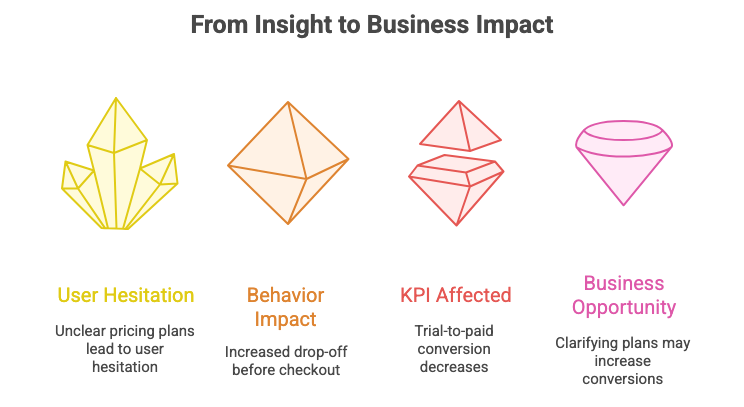
1. User Insight
Example: “Users hesitate on the pricing page because the plan differences are unclear.”
2. The Behavior Impact
Example: “This increases drop-off before checkout.”
3. The KPI Affected
Example: “This directly affects trial-to-paid conversion.”
4. The Business Risk or Opportunity
Example: “Clarifying plan benefits may increase conversions by 8 to 12 percent based on past patterns.”
This structure turns a raw observation into a business argument.
Examples you can borrow
Insight: Users guess which onboarding option fits them.
KPI: First-run success rate.
Why it matters: Misaligned onboarding leads to early churn.
Example statement: “Fixing onboarding clarity can increase first-run success and reduce early churn risk.”
Insight: Customers cannot find receipts in their dashboard.
KPI: Support ticket volume.
Why it matters: Billing questions create costly, repetitive tickets.
Example statement: “Improved receipt visibility could cut billing tickets by 20 percent.”
Insight: Users abandon checkout when the coupon field is hidden.
KPI: Completed orders.
Why it matters: Checkout friction directly reduces revenue.
Example statement: “A visible coupon field could lift completed orders by 5 to 9 percent.”
This is the language leadership understands immediately.
Common mistakes
• Presenting research themes with no KPI reference
• Using phrases like “users prefer” without showing stakes
• Over-quantifying without evidence
• Focusing on UX metrics alone instead of shared KPIs
• Assuming stakeholders will make the connection themselves
Insights gain power when they sit next to the business metric they influence.
Resource Corner
What are KPIs? Key Performance Indicators
KPI Reports Explained: Your Complete Guide
16 product management KPIs and how to track them
Final Thought
Research earns credibility when it speaks the language of impact.
If an insight changes user behavior and that behavior affects a KPI, you have a lever leadership will always pay attention to.
Map your findings to the numbers that matter and watch the conversation shift from “good research” to “strategic priority.”

