
How to use Google Analytics for UX research....Part 1
Leverage on user-generated data for insights.


While Google Analytics is often viewed as a marketing tool, offering website traffic statistics and basic user behavior data, for UX researchers, it can be a treasure trove of insights. When wielded strategically, Google Analytics data can complement and enrich your user research endeavors, guiding you towards a deeper understanding of user behavior and informing crucial design decisions.
Here's a detailed roadmap for UX researchers to unlock the power of Google Analytics and transform it into a user research powerhouse:
Demystifying User Demographics and Behavior:
Audience: Delve deeper than just website traffic numbers. Google Analytics' audience reports provide a wealth of demographic data, including user age, location, language, and device preferences. This allows you to paint a detailed picture of your user base.
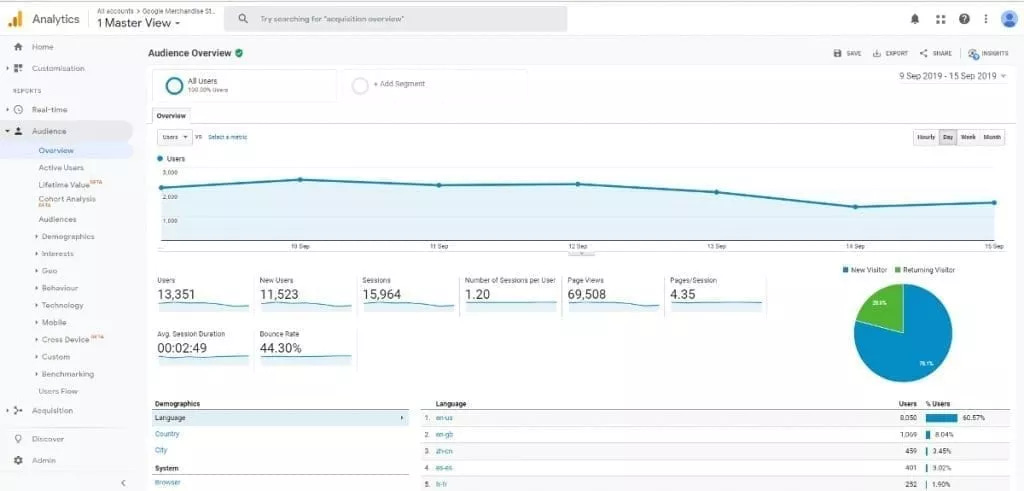
This image shows a sample Audience Report in Google Analytics. It allows you to see the demographics of your website visitors, such as age, location, language, and device used.
Example: Imagine you're designing a learning management system (LMS) for a corporate audience. Google Analytics data reveals a large portion of users accessing the platform from mobile devices during evenings and weekends. This suggests a user base that prioritizes flexible learning on-the-go. This insight can inform your research by prompting you to recruit users who primarily access the LMS from mobile devices and to tailor your interview questions to explore their mobile learning preferences and potential pain points.
Before we continue….
Is Your UX Case Study Sabotaging Your Dream Job?
Join us

In This Workshop You'll Discover:
The #1 Reason Your Case Study is Repelling Recruiters (It's Not What You Think!)
How to Craft a Narrative So Compelling, Interviewers Will Be Begging to Hear More
Secret Design Hacks to Make Your Case Study Visually Stunning (No Design Skills Needed!)
Limited slots left
……back to where we stopped
Acquisition: Don't just track website traffic; understand where it originates. Google Analytics' acquisition reports reveal how users find your website (organic search, social media referrals, paid advertising, etc.).
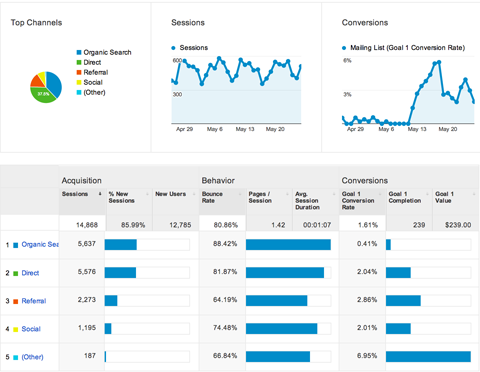
This image shows a sample Acquisition Report in Google Analytics. It reveals the different channels through which users found your website. Understanding these acquisition sources can help you tailor your research to the specific needs and expectations of users arriving from different channels.
Example: Let's say you're revamping the user interface (UI) for a travel booking website. Google Analytics data shows a significant portion of users arriving through social media campaigns. This suggests a user base potentially influenced by visually appealing content and user recommendations. By incorporating user interviews with individuals who found the website through social media, you can gain valuable insights into their decision-making process and their expectations for a visually compelling and user-friendly booking experience.
Behavior: Move beyond basic page views and delve into user navigation patterns. Google Analytics provides metrics like bounce rate, average session duration, and page views to identify areas of high user engagement and potential drop-off points.
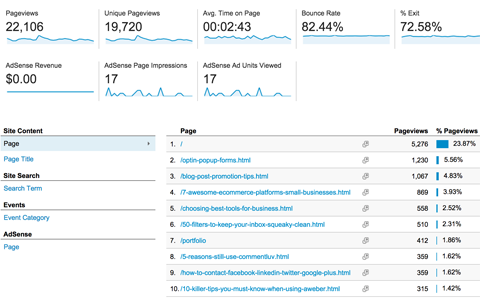
This image shows a sample Behavior Report in Google Analytics. It provides metrics like bounce rate, average session duration, and page views, helping you understand how users navigate your website and identify potential areas of frustration or confusion.
Example: You're optimizing the checkout process for an e-commerce website. Google Analytics data reveals an unusually high bounce rate on the payment confirmation page. This suggests potential user frustration or confusion during the final stages of checkout. By analyzing user behavior flow and conducting user testing focused on the checkout process, you can uncover the root cause of the high bounce rate.
Leveraging Powerful Features In Google Analytics for Deeper Insights:
Behavior Flow: Visualize the user journey! Google Analytics' behavior flow reports map how users navigate your website, highlighting common paths and potential roadblocks. This allows you to identify areas where users might be getting lost or confused, prompting you to investigate further through user testing or targeted surveys.
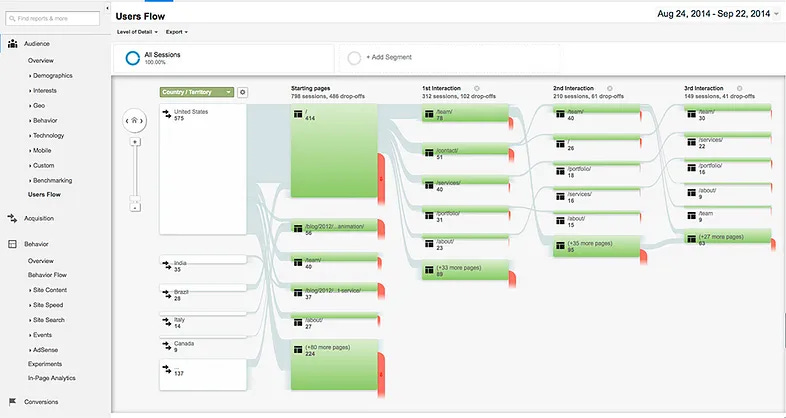
This image visually represents the journey users take on your website, highlighting entry and exit points. This can help you identify areas where users drop off unexpectedly and investigate potential usability issues. for example —Imagine you're redesigning the information architecture of a complex B2B software platform. Google Analytics' behavior flow report reveals a significant number of users abandoning the platform after visiting the product features page. This suggests potential difficulty in understanding the software's value proposition or navigating the features list.
Tip: By conducting user interviews and usability testing specifically focused on the product features page, you can gather qualitative data to understand user expectations and identify areas for improvement in clarity and user guidance.
Site Search: What are users looking for on your website? Analyze user search queries within Google Analytics' site search reports. Unidentified search terms or searches with low results could indicate a content gap or a confusing information architecture.

This image depicts a sample Site Search Report in Google Analytics. It displays the search terms users entered on your website and the frequency of those searches. Analyzing these terms can reveal content gaps or areas where your information architecture might be confusing users.
Example: You're optimizing the content strategy for a news website. Google Analytics' site search report reveals frequent searches for specific topics that aren't currently covered on the website. This suggests a user need for additional content on these particular subjects. By incorporating these user-generated topics into your content brainstorming sessions, you can ensure your website offers the information users are actively seeking.
Event Tracking (The Game Changer): Don't be limited by basic page views! Set up custom event tracking in Google Analytics to capture specific user interactions beyond just page loads. This could include clicks on buttons, downloads of documents, video engagement, or form submissions. By tracking these micro-interactions, you can gain a granular understanding of how users interact with your website's features and identify areas for optimization.
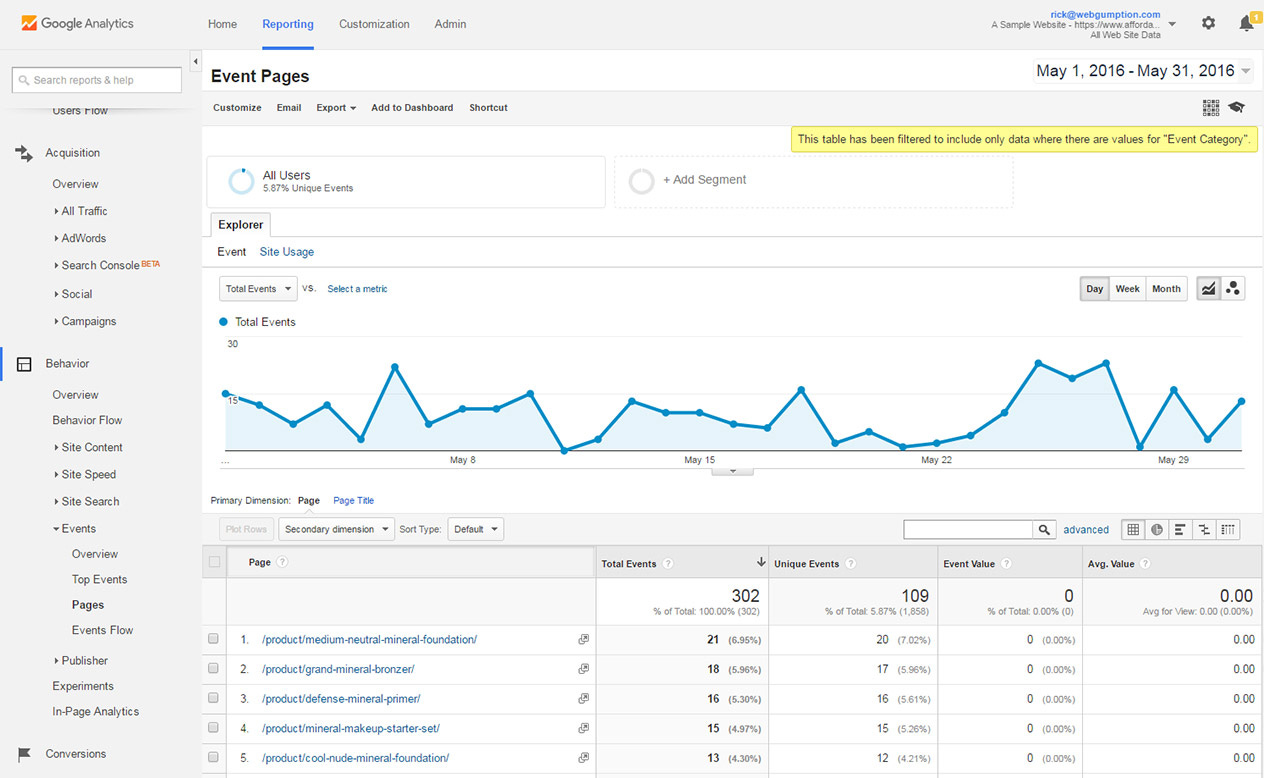
This image shows a sample Event Tracking Report in Google Analytics. It allows you to see how users interact with specific elements on your website beyond just page views. By tracking these micro-interactions, you can gain a deeper understanding of how users engage with your features and identify areas for improvement.
Example: You're redesigning the user onboarding process for a mobile app. Google Analytics event tracking reveals a low click-through rate on the "Get Started" button within the onboarding flow. This suggests potential user hesitation or lack of clarity about the button's purpose. By conducting A/B testing with different button variations and user interviews focused on the onboarding process, you can gather both quantitative and qualitative data to understand why users are hesitant to click and iterate on the onboarding flow for improved user engagement.
Things to note (Important consideration)
Limitations of Google Analytics: While Google Analytics is a powerful tool, it has limitations. Google Analytics data doesn't tell you the "why" behind user behavior. It provides "what" and "how much" information. Use it alongside other research methods like user interviews and usability testing to gain a more complete picture of the user experience.
Data Privacy: Always ensure you comply with data privacy regulations (like GDPR and CCPA) when collecting and analyzing user data in Google Analytics. Obtain proper user consent and anonymize data where necessary.
By employing Google Analytics strategically, you can transform it from a simple website traffic monitor into a valuable tool for UX research. Remember, Google Analytics data is just one piece of the puzzle. Combine it with qualitative research methods to paint a comprehensive picture of the user experience. This data-driven approach will empower you to make informed design decisions that truly resonate with your users and create a website or application that delivers an exceptional user experience.
Combining Google Analytics with the Power of Qualitative Research
Remember, Google Analytics data provides a quantitative perspective – the "what" and "how much" of user behavior. To gain a holistic understanding of the "why" behind user actions, it's crucial to combine Google Analytics insights with qualitative research methods:
Read more on this in Part 2 coming next week!
Enjoyed this newsletter? Share it with a friend!
Have a great weekend,
The RB Team