Bridging Qualitative Stories With Quantitative Proof
Three pitfalls to avoid when mixing methods
A moving user story can win hearts. But numbers? They win budgets.
We’ve all been there.
You share a powerful quote from a usability test a moment that perfectly captures the friction users feel. Heads nod. People “get it.”
Then the next question lands: “But how many users is this actually affecting?”
And just like that, your story becomes “nice to know” instead of “must act on.”
Bridging qualitative stories with quantitative proof is how you turn human insight into business action.
Why “stories vs. numbers” is a false choice
The two-way street between qualitative and quantitative
How to link emotional impact with statistical weight
Three pitfalls to avoid when mixing methods
Examples from UX research teams
UXCON25 spotlight: Selling research through proof and empathy
Resource corner
Why “Stories vs. Numbers” Is a False Choice
Qualitative insights are rich, emotional, and context-driven. Quantitative data is scalable, measurable, and repeatable.
Neither is “better.”
The magic happens when they meet, when you can say: Here’s the pain point, here’s the scale of it, and here’s why it matters.
The Two-Way Street Between Qual & Quant
Qual → Quant
Use interviews, usability tests, and open-ended feedback to uncover patterns, then validate them with surveys or analytics.Quant → Qual
Use analytics or large-scale surveys to spot anomalies or trends, then dig deeper with interviews to understand why.
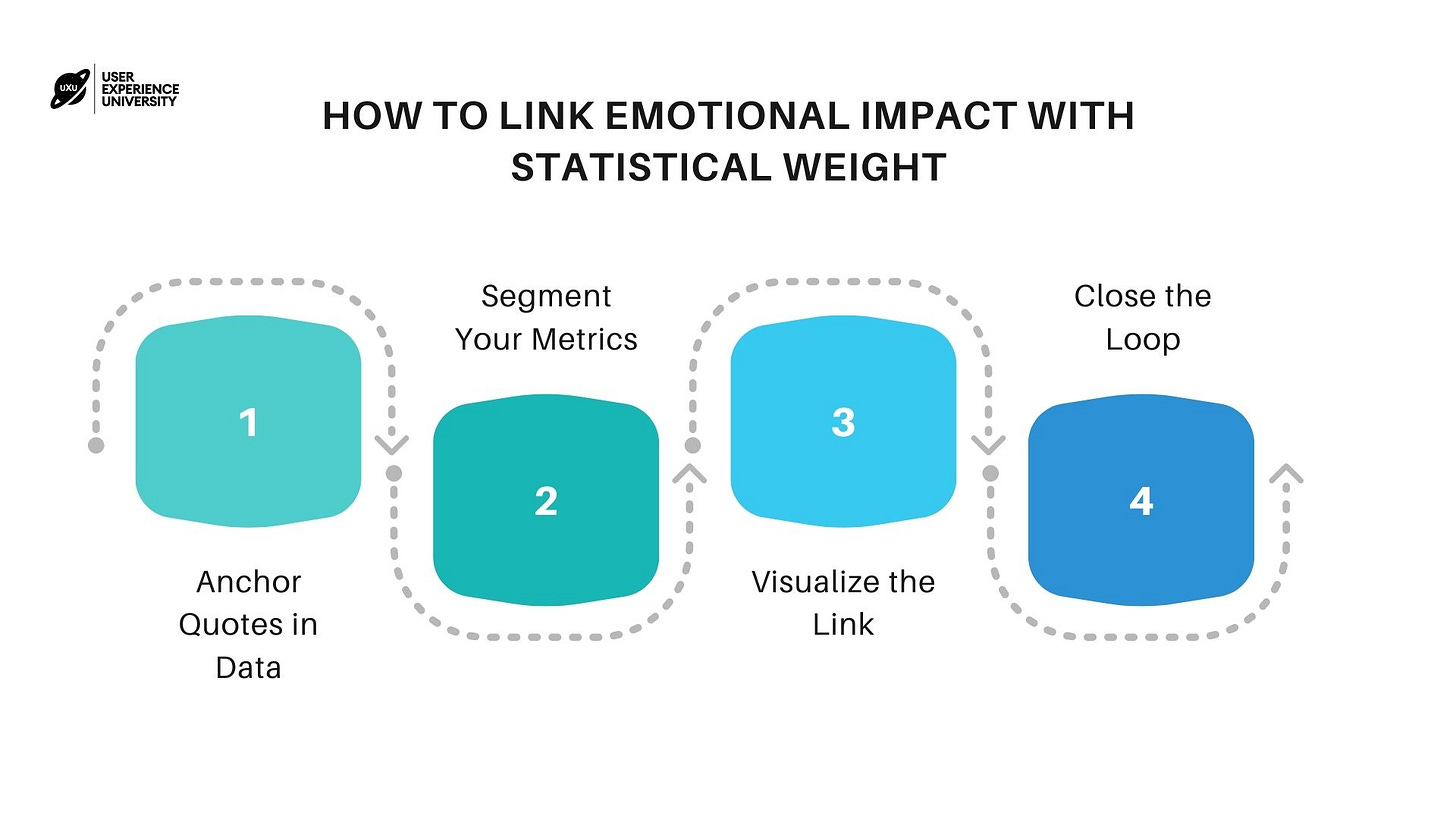
How to Link Emotional Impact with Statistical Weight
Anchor Quotes in Data
If 62% of users failed to complete onboarding, open with a real user quote that makes the failure human.Segment Your Metrics
Break results by audience type to make the numbers personal for stakeholders.Visualize the Link
Use side-by-side visuals: one column for qualitative themes, one for the supporting numbers.Close the Loop
After testing changes, measure the impact both in user feedback and hard metrics.
Three Pitfalls to Avoid
Cherry-Picking – Don’t just choose the story that fits your narrative. Include representative perspectives.
Over-Generalizing – Avoid making a single powerful story sound universal without data.
Data Dumping – Numbers without context don’t drive action. Pair them with real voices.
UXCON25 Spotlight: Proof + Empathy in Research
At UXCON25, we’ll explore:
How to present data that executives can’t ignore
Ways to weave user voices into metrics-heavy decks
When not to quantify, and why
🎟️ Get your ticket and learn how to make your research unshakable.
UX Scenarios
E-commerce Checkout Experience
Quantitative Insight: A UX case study reveals metrics like cart abandonment, bounce rates, and page load delays to pinpoint where friction lies UX Planet.
Qualitative Insight: Interviews or usability sessions then uncover shopper frustration or confusion e.g., “I felt lost,” “Nervous at payment,” etc.
Result: By marrying the two, you identify both where and why the drop-off occurs.
Digital Health/Mental Health App Engagement
Quantitative Findings: A meta-analysis of mental health apps shows they can significantly improve outcomes with a medium effect size providing proof of impact (Meta-analysis)
Qualitative Insights: Other reviews show emotional factors like privacy, stigma, or perceived judgment strongly influence engagement (National Elf Service).
Synthesis: Understanding emotional barriers helps design features backed by both empathy and evidence.
Resource Corner
Final Thought
Numbers can justify a decision. Stories can inspire one.
When you blend them, you’re not just making a case, you’re making change inevitable.


Appreciate this. The whole Quant/Qual piece made me think about how, in the longevity economy, the goal isn’t to force qualitative stories into dashboards, but to treat them as foundational — not supplementary. Especially with users over age 50, the lived experience often is the insight.